The Datamap provides automated data mapping, discovery, and classification of sensitive dataflows across all your repositories. It gives privacy teams a live, code-level view of where sensitive data is collected, processed, and shared — including flows into AI and third-party integrations that questionnaire-based approaches typically miss — covering both safe and risky data sinks.
The Datamap offers two flowchart views and four table views:
| View | Description |
|---|---|
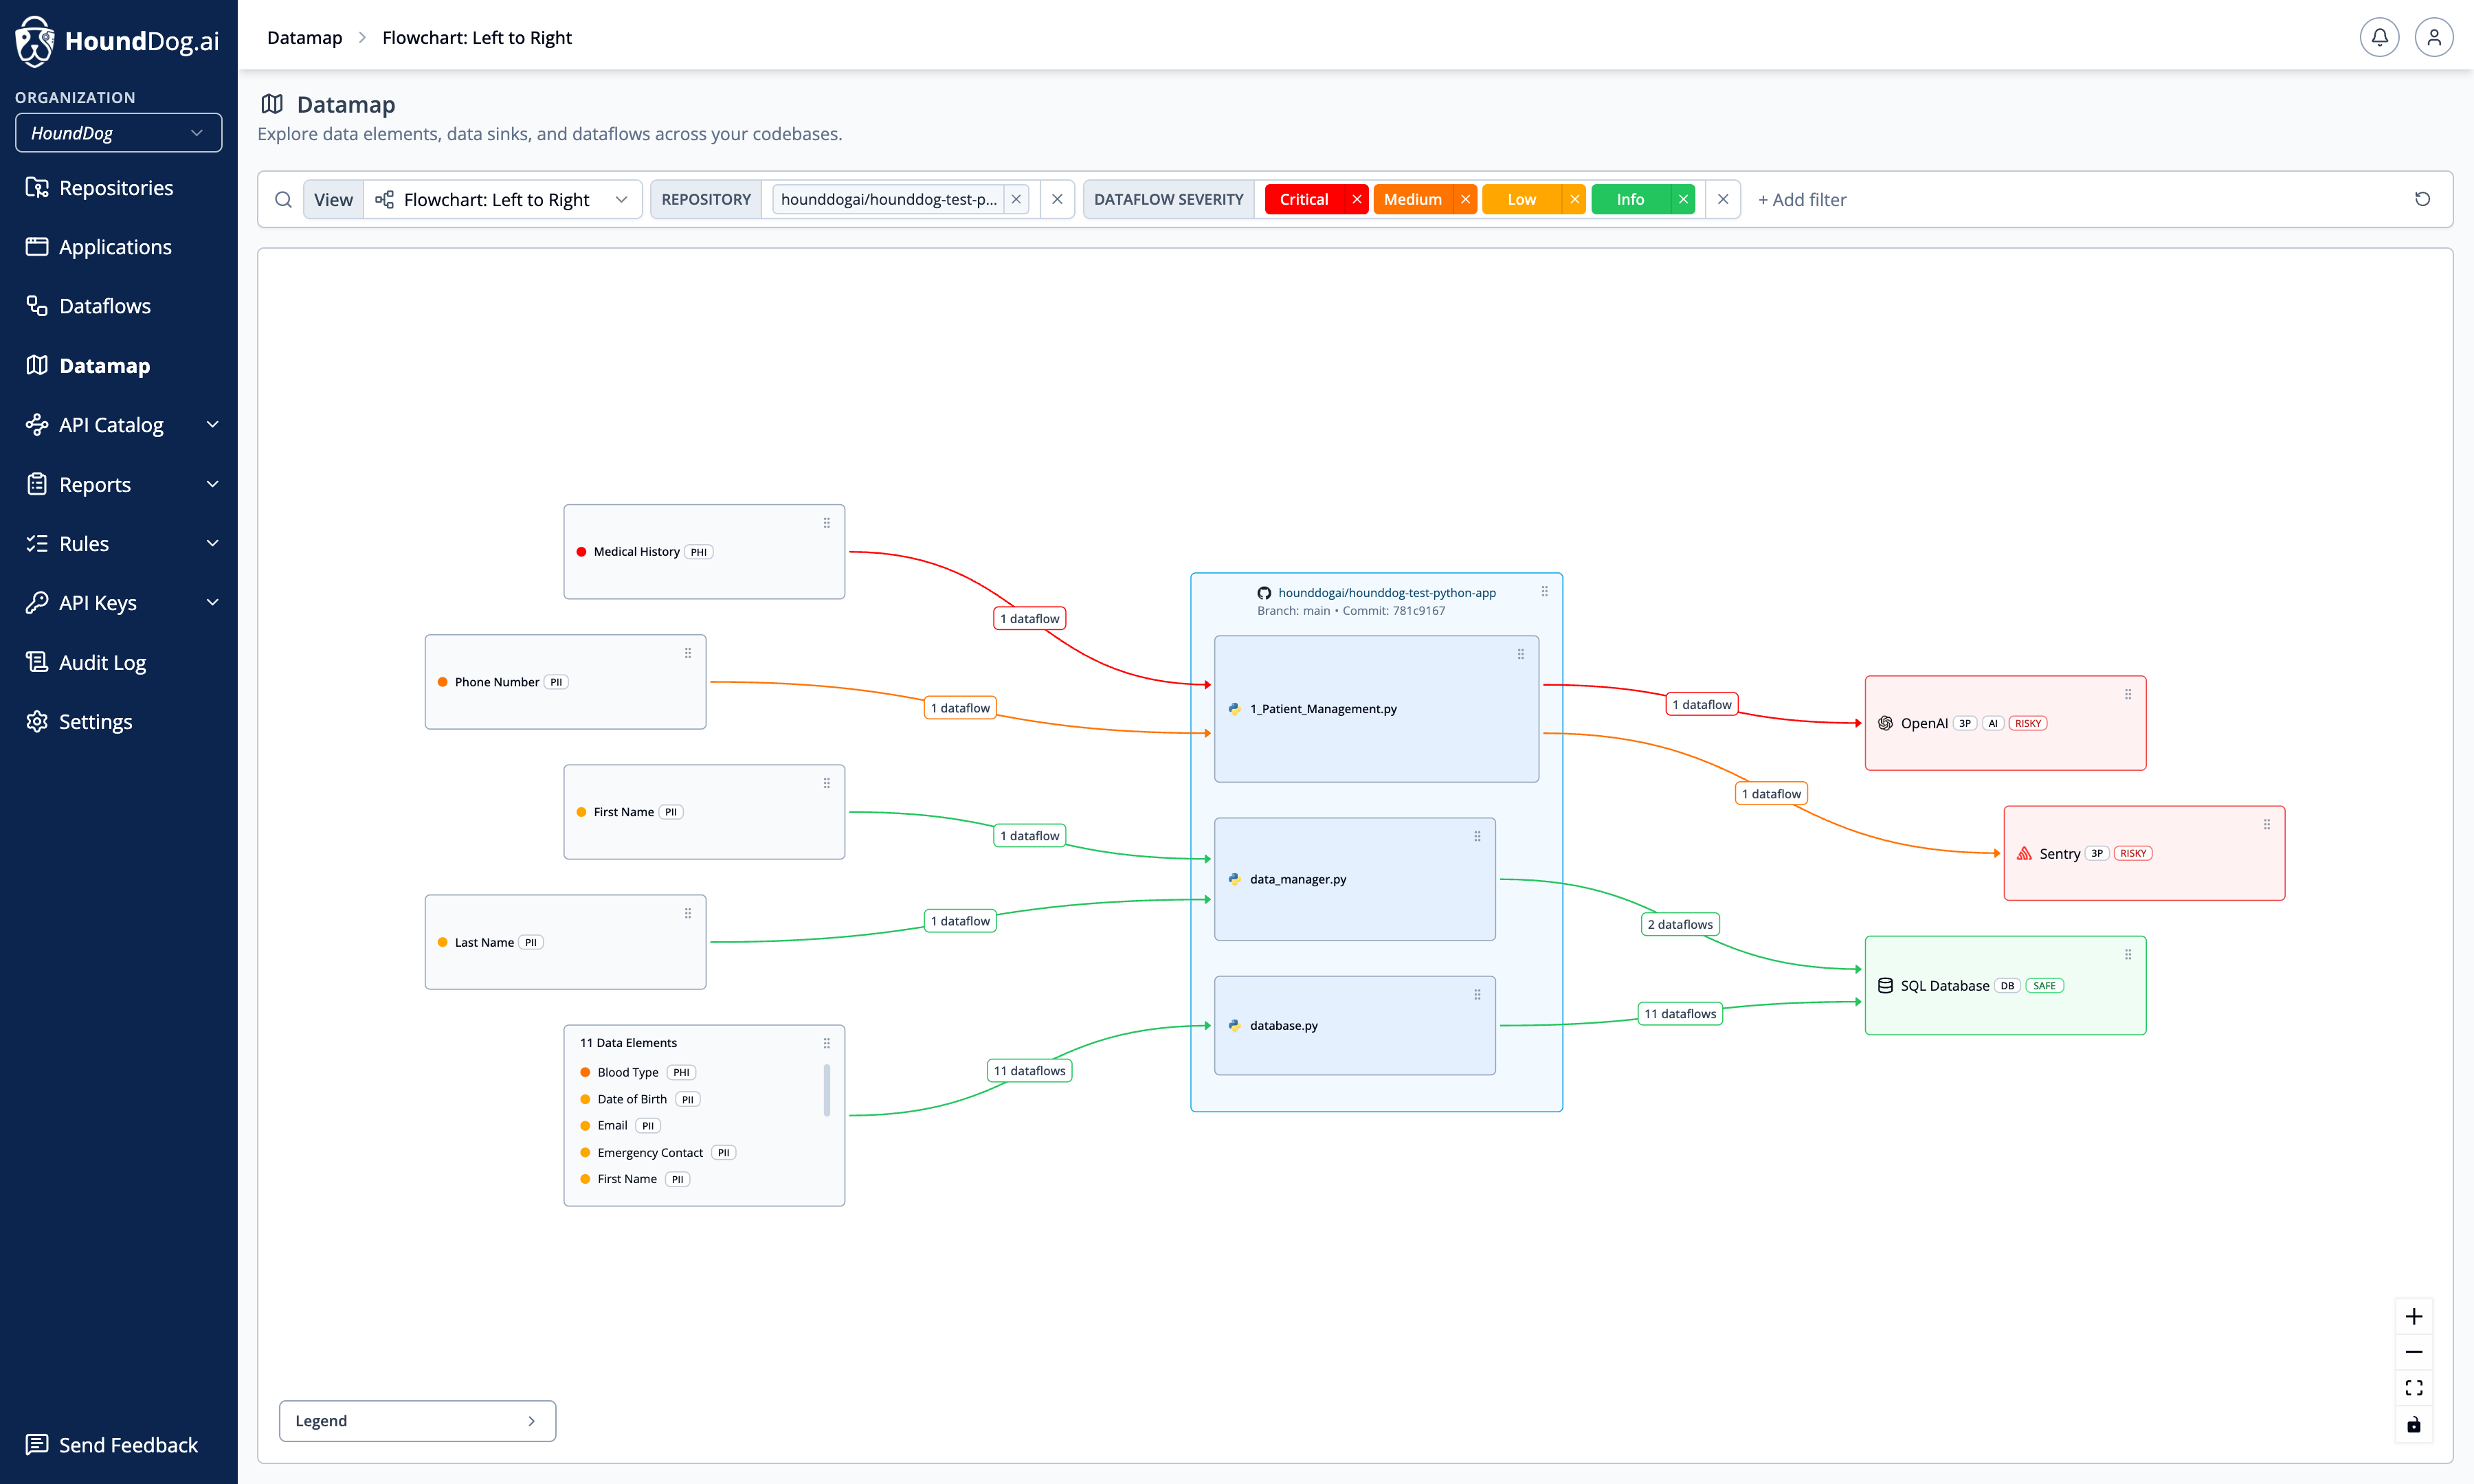
| Flowchart: Left to Right | Data elements on the left flowing into data sinks on the right. |
| Flowchart: Top Down | The same flow rendered vertically — the default on tall viewports. |
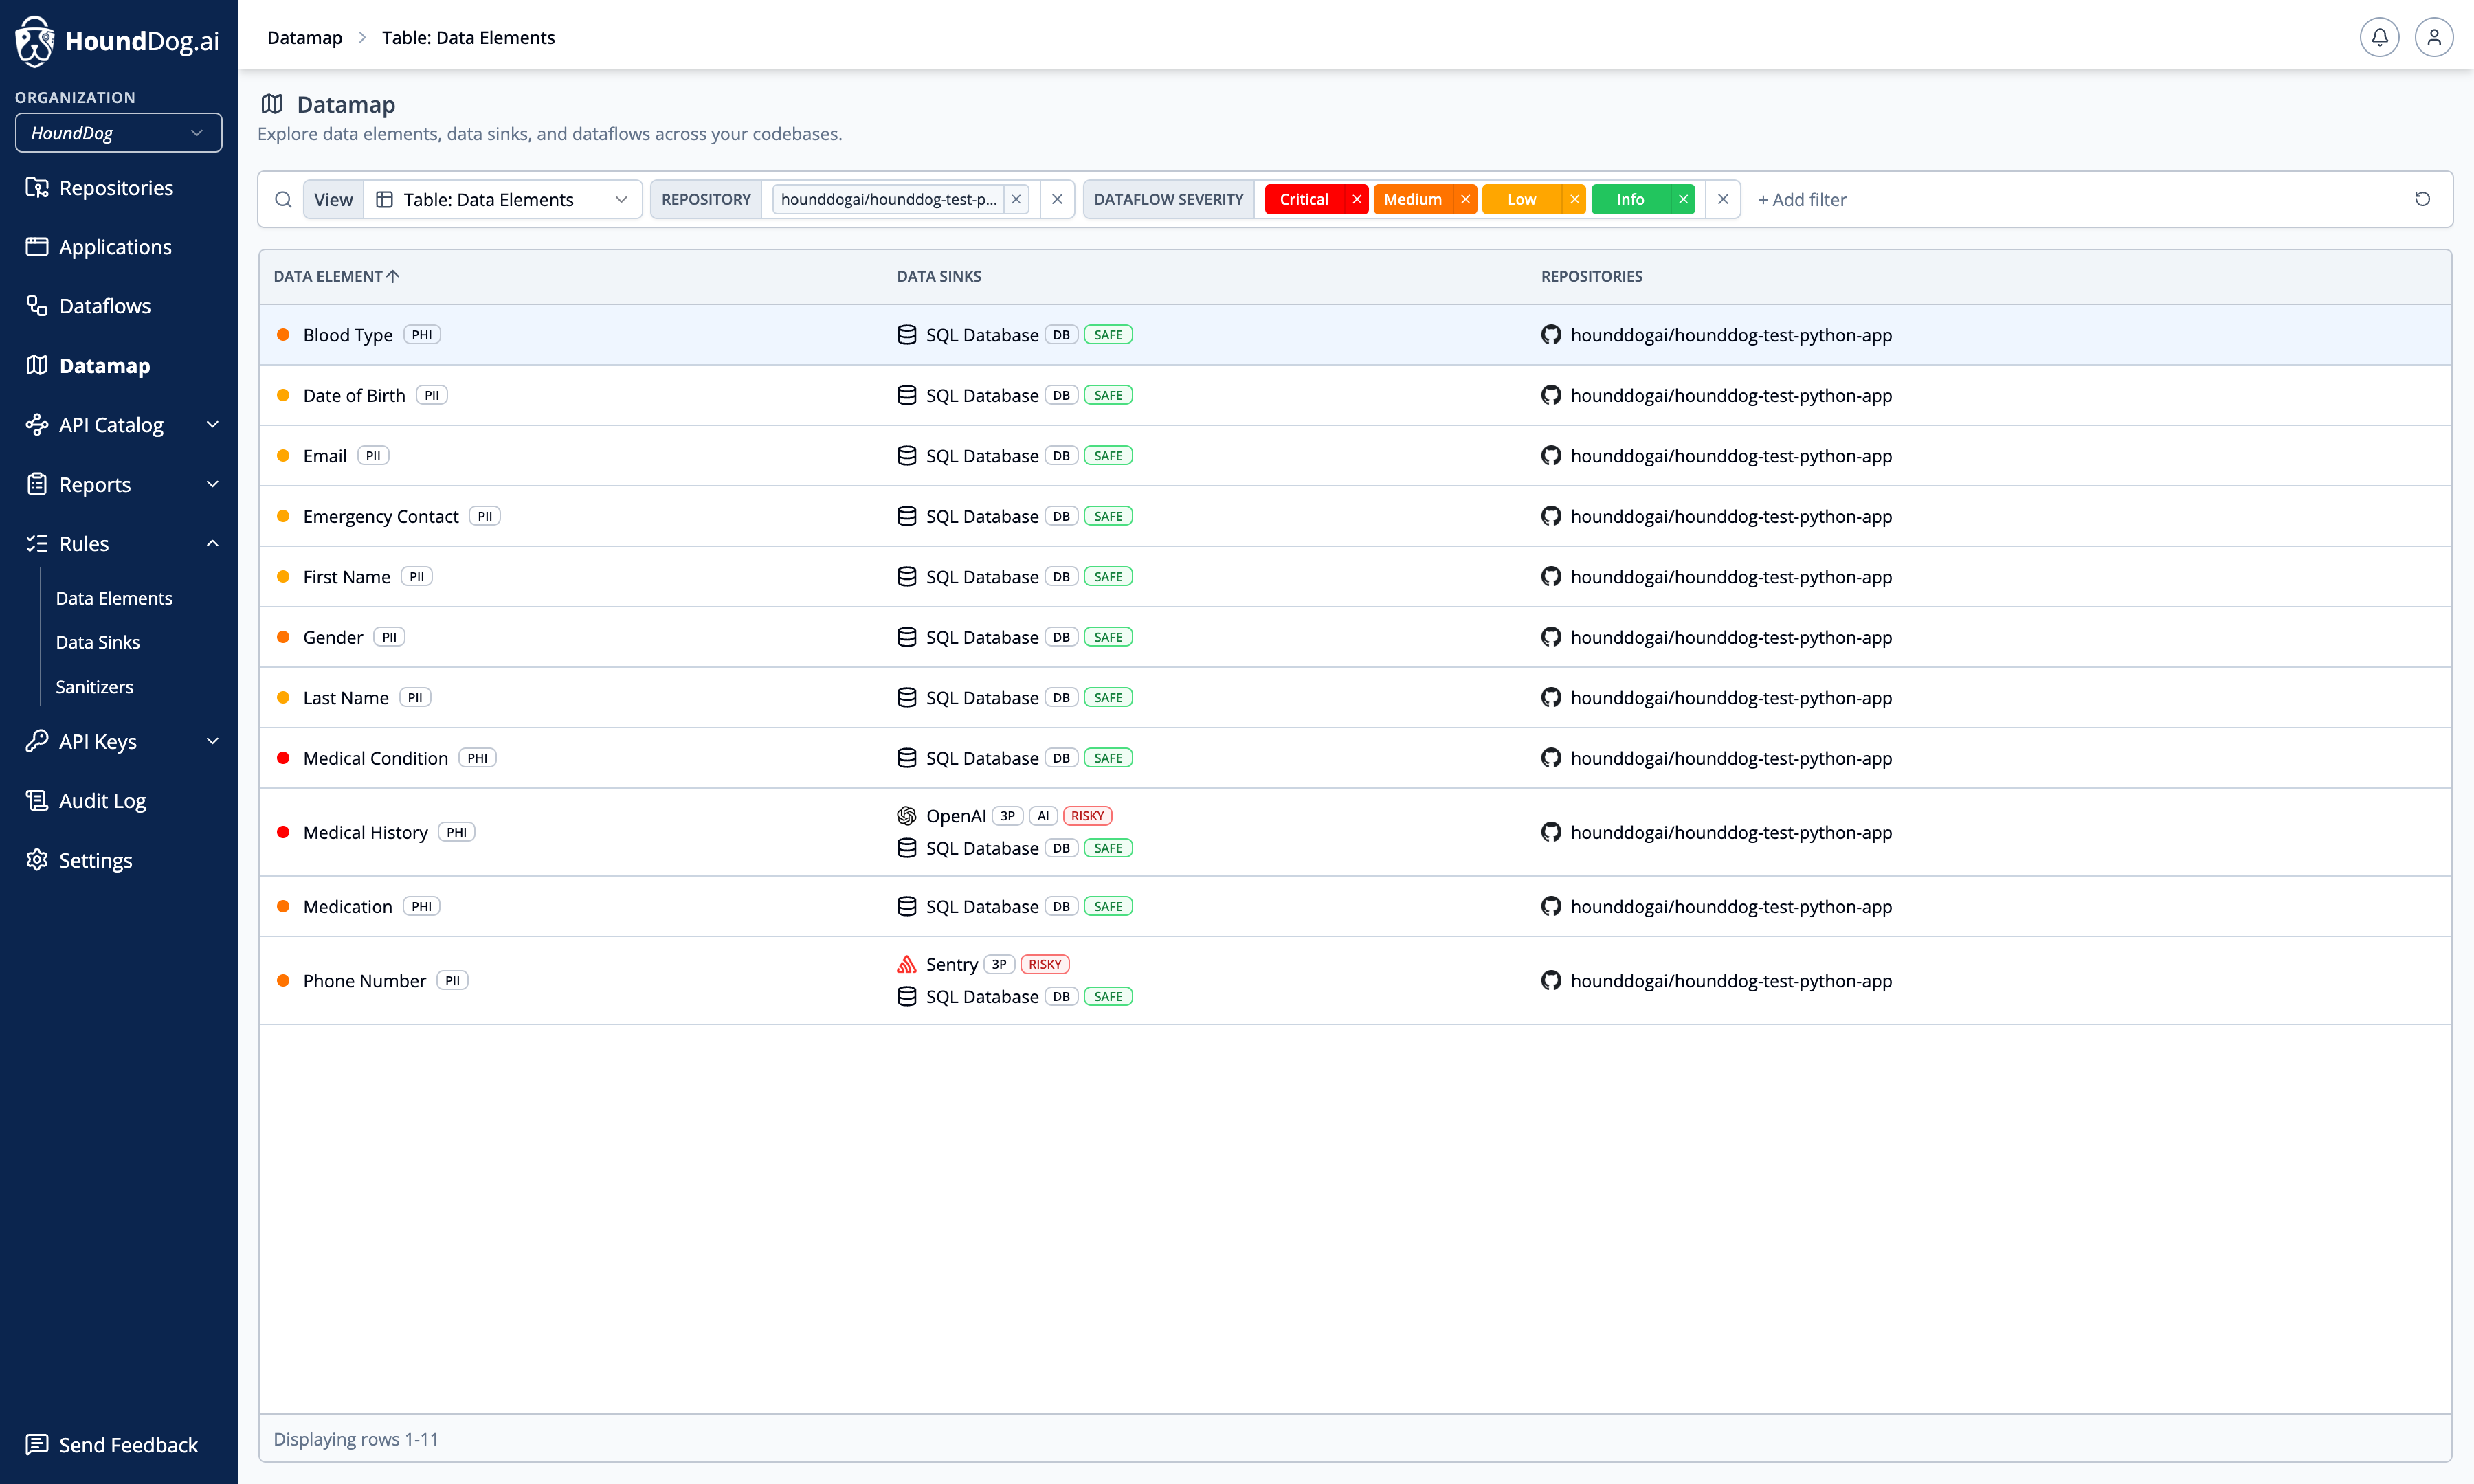
| Table: Data Elements | All detected data elements, with the repositories and sinks they touch. |
| Table: Data Sinks | All detected data sinks, with the data elements they receive. |
| Table: Repositories | Repositories with their dataflow counts by severity, detected data elements, and data sinks. |
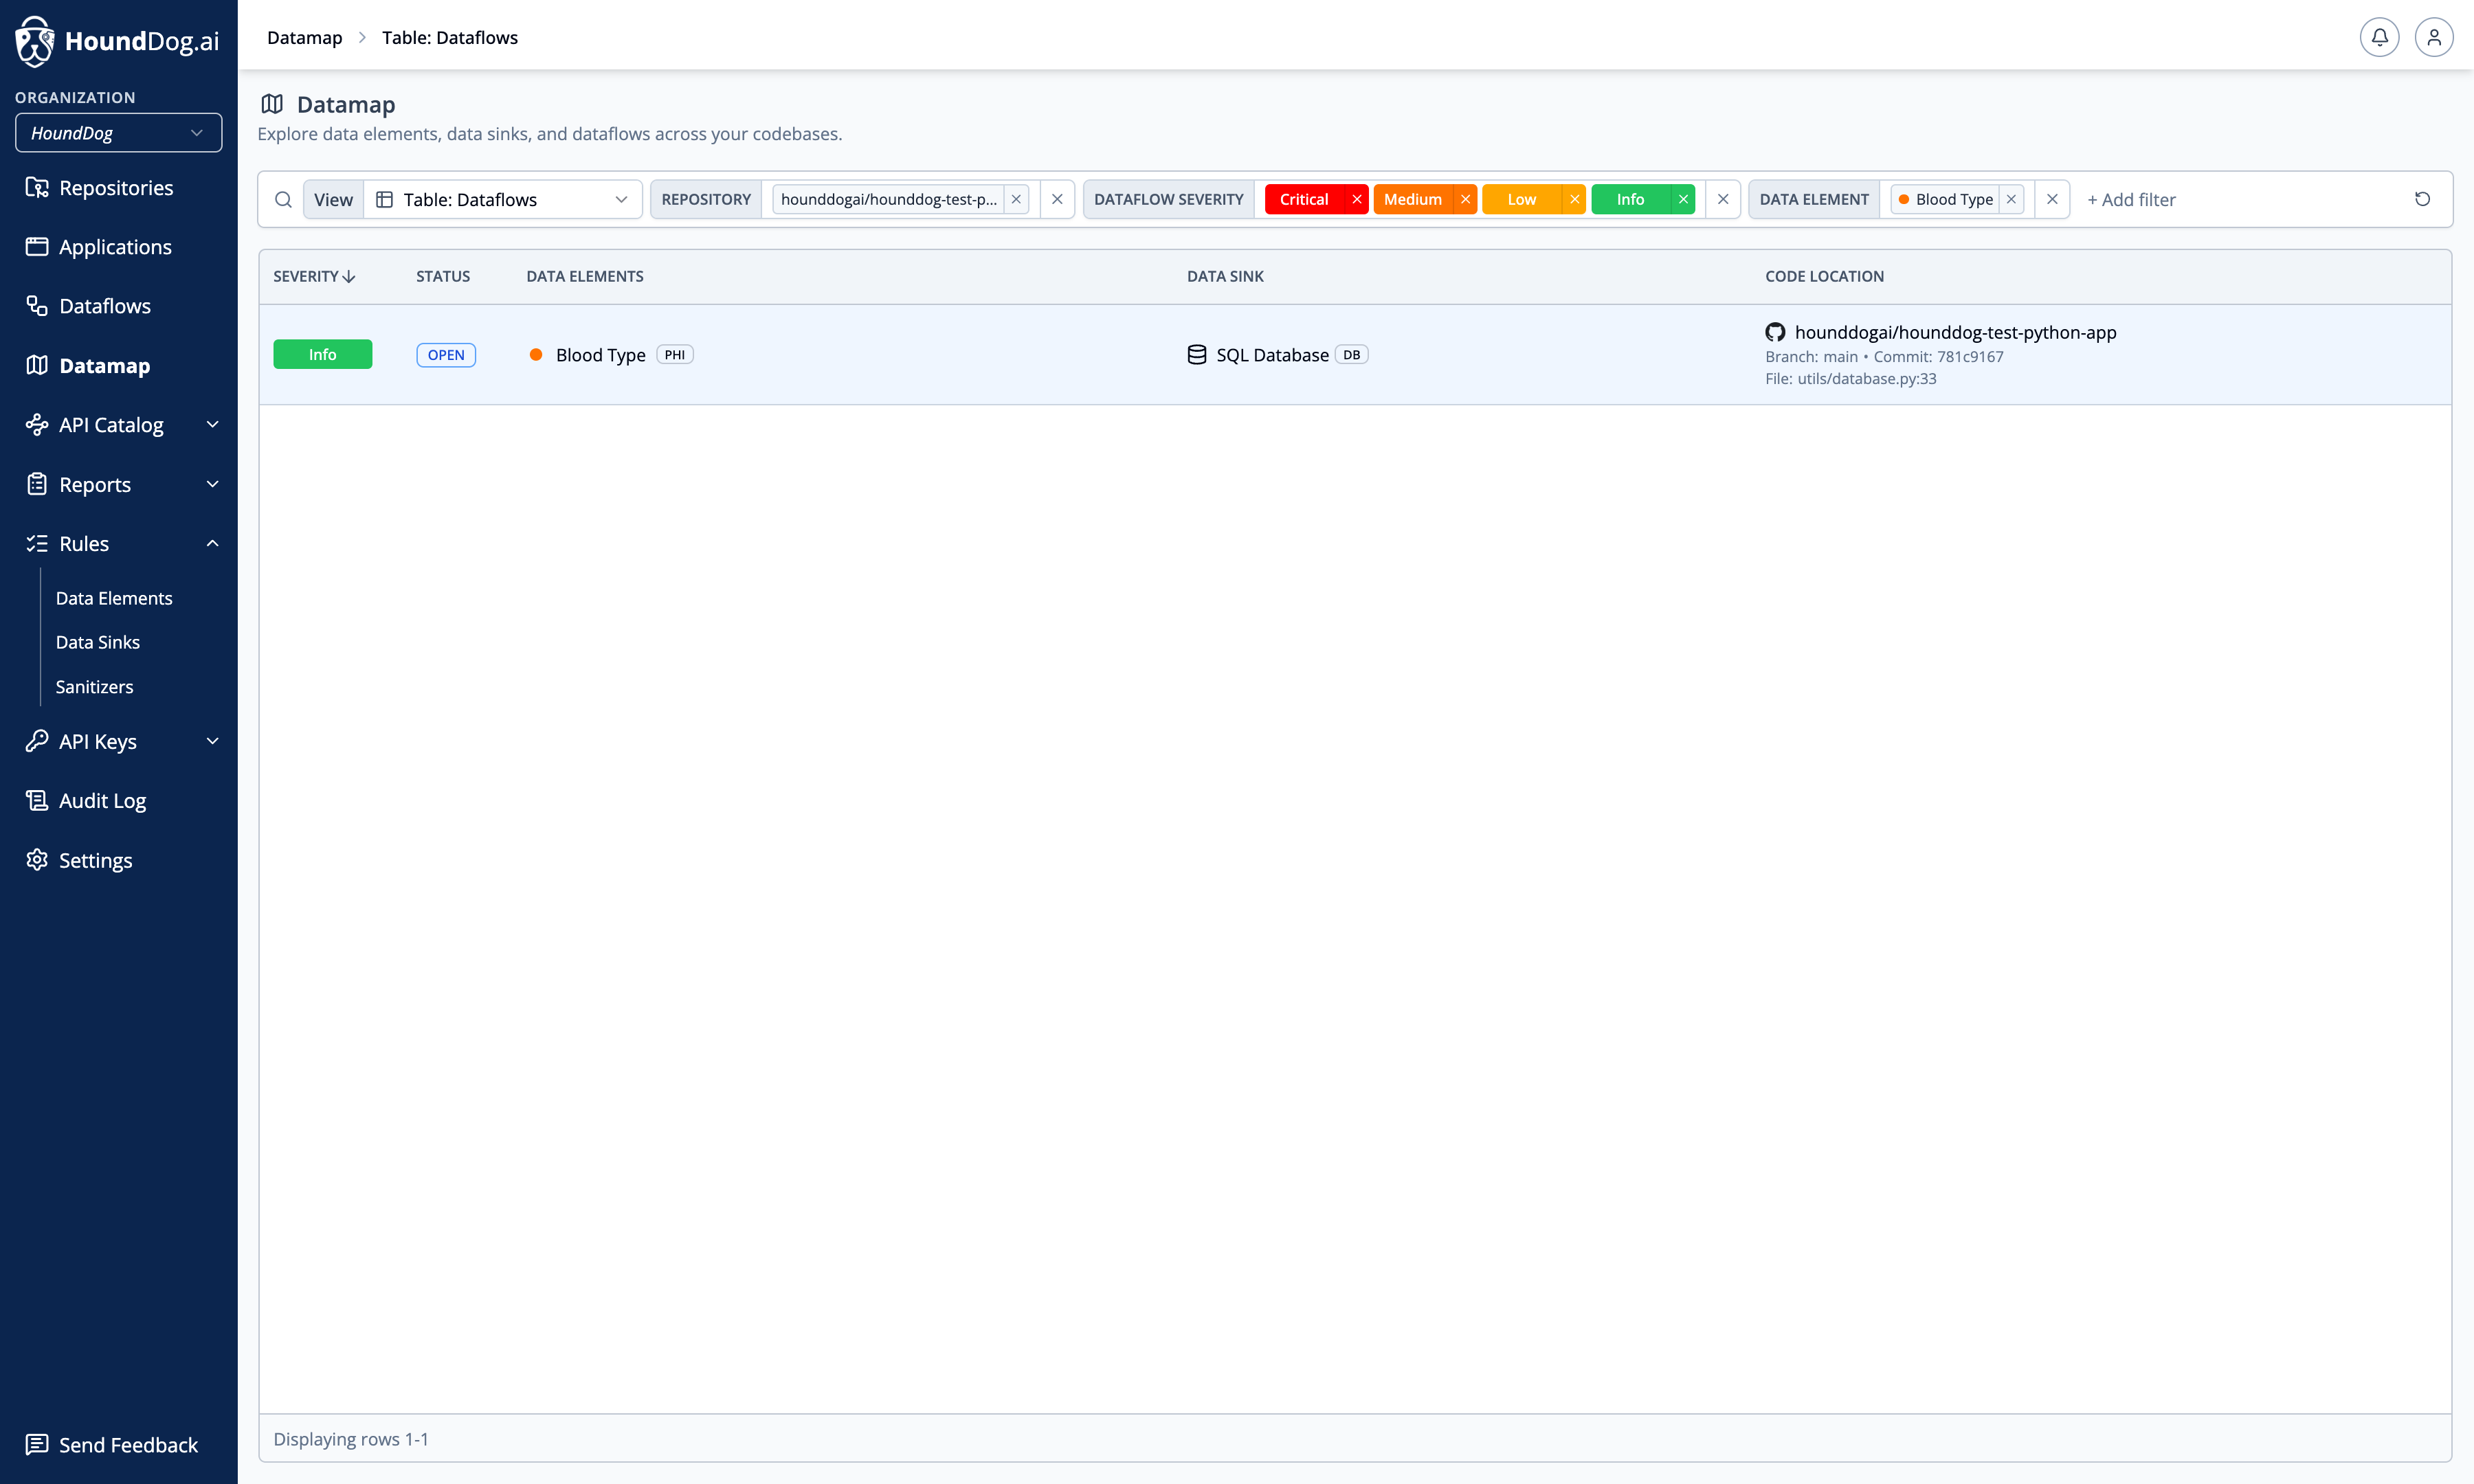
| Table: Dataflows | The underlying dataflows in tabular form. |
Filters for Repository (and branch), Application, Data Element, Data Element Sensitivity, Data Element Tag, Data Sink, Data Sink Tag, Dataflow Severity, gRPC Service, and Thrift Service apply across views. A Dataflow Status filter is available on the Table: Dataflows view. Each view answers a different kind of question:
- By repository — select an application’s repositories (say, backend, frontend, and an authentication service) to get a comprehensive view of every dataflow in that application.
- By data element — “show me every repository where Social Security Number is processed” and every sink it may be exposed to.
- By data sink — “show me all sensitive data sent to OpenAI across the organization.”
The flowchart views place data elements on one side and data sinks on the other, with dataflow counts on every edge and risky sinks highlighted. The middle column depends on the repository filter: a single organization node when no repository is selected, one repository node per selected repository, and individual file nodes when exactly one repository is selected.
Drilling Down
Section titled “Drilling Down”Click a data element — or any dataflow count — to drill into the underlying dataflows, filtered to that element: each flow’s severity, status, data sink, and exact code location. From there, open any flow on the Dataflows page for full traces, remediation guidance, and triage actions.